
Projects for
quality of life
From apps to custom management systems, we integrate existing systems and develop complete solutions with you, carefully handling both interface and logic.
Software Development
From apps to custom management systems, we integrate existing systems and develop complete solutions with you, carefully handling both interface and logic.
IT Support
We respond to breakdowns, slowdowns, and operational needs. We support you remotely or on-site to keep everything running smoothly, without stress.
Computers and Business Networks
From device setup to network management, we ensure stability, security, and access wherever needed.
Software Integration
We connect management systems, databases, platforms, and physical devices to automate workflows and reduce manual work.
Do you have a
well-structured company
or one that’s still growing?
Contact usWhat we do
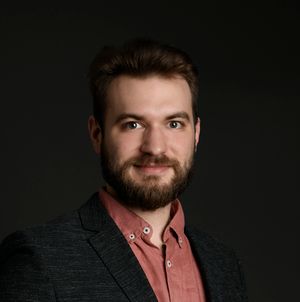
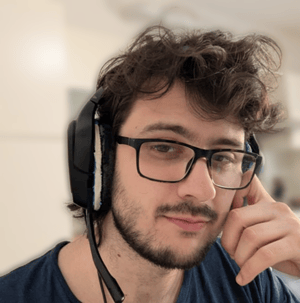
Elisa V.
Sales Assistant
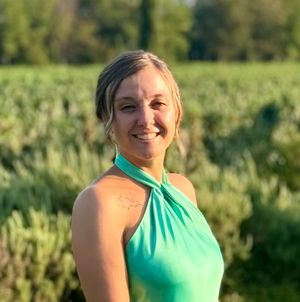
Chiara M.
Accountant

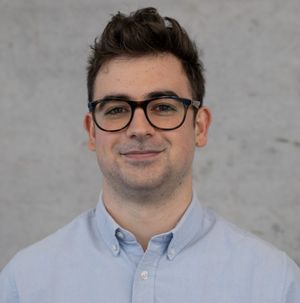
Alexandro P.
Frontend Developer

A team with field experience.
We support companies with a concrete, flexible approach based on what really works.



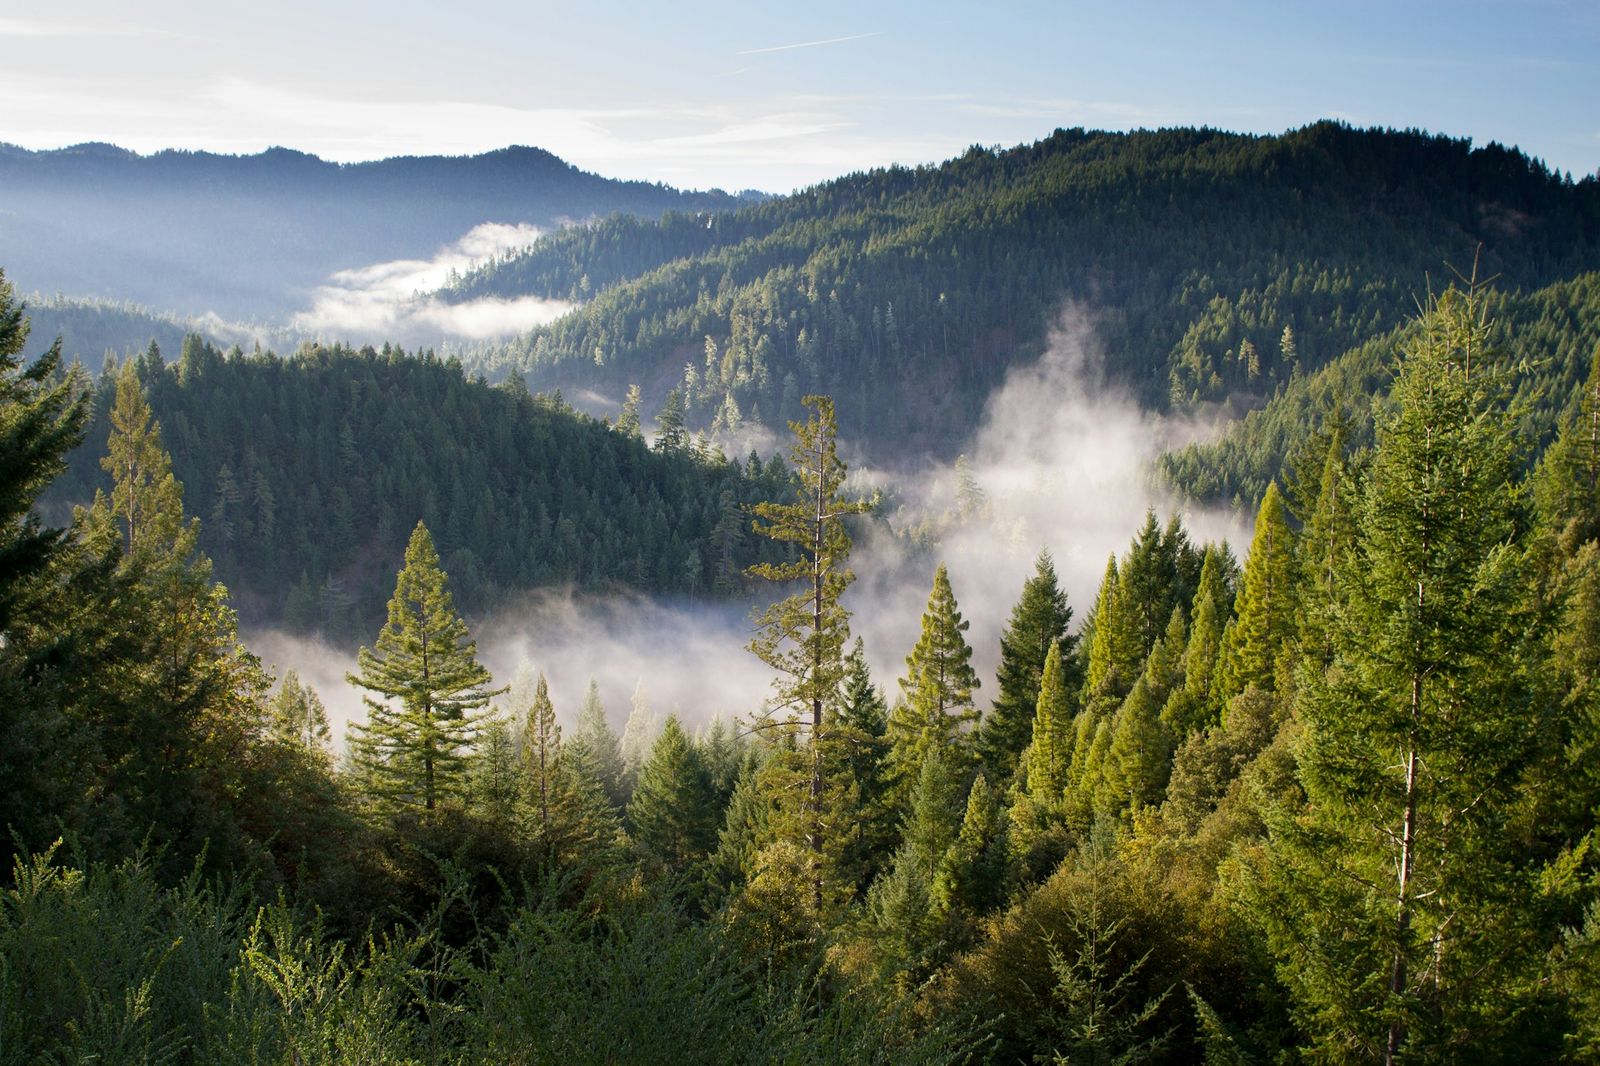
fabricators is green
(really).
We have a forest on Treedom that grows with us.
Every project is special: for every software development we plant a tree on Treedom, a concrete gift for clients and the planet.

A clear method in three steps.
1
Targeted needs analysis.
With precise questions we quickly identify the real operational requirements.
2
Defining a clear plan.
We organize timing and costs transparently so every choice is calm and informed.
3
Presenting an organized quote.
Each activity is carefully planned and communicated in a simple, direct way.